What is TES?
Scientists at Arizona State University’s Mars Space Flight Facility designed and operated the Thermal Emission Spectrometer (TES) instrument on NASA’s Mars Global Surveyor orbiter. TES measures the thermal infrared energy (heat) emitted from Mars in many infrared “colors.” This technique, called thermal emission spectroscopy, can tell us much about the geology and atmosphere of Mars.
What does it do?
The TES instrument systematically measured and monitored the Martian surface and atmosphere throughout all phases of the mission. The TES spectrometer collected over 206 million infrared spectra, and the TES bolometer was in continual full-time use throughout the entire mission.
Why is it Significant?
TES was and is both an instrument and a technique. The purpose of TES was to measure the thermal infrared energy (heat) emitted from Mars. This technique, called thermal emission spectroscopy, can tell us much about the geology and atmosphere of Mars. TES data provided the first detailed look at the composition of Mars.
Instrument Gallery
TES Discoveries
Frequently Asked Questions
- How many TES spectra were collected?
The number of spectra collected in any given month varied according to the rate at which data could be returned, the number of spacecraft maneuvers that precluded “typical” data acquisition patterns, and other factors. The final count of TES spectra collected during the aerobraking, mapping, and extended phases of the mission was 206,219,475. See the TES site for more detailed information.
- What is thermal IR energy?
Light and Heat
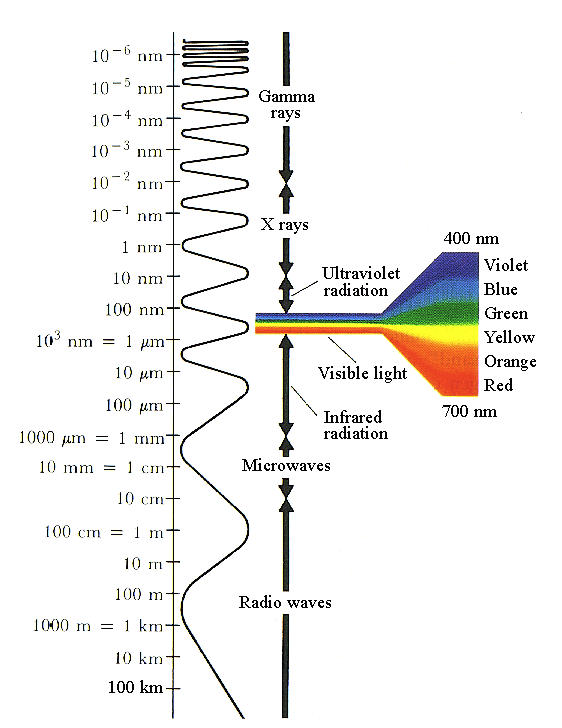
Thermal IR energy is more commonly known as “heat”. Everyone is familiar with heat because of our sense of touch. But what exactly is heat? Heat is a form of light invisible to our eyes, but detectable with our skin. Visible light is part of a large spectrum of energy that includes other familiar electromagnetic energy regions: microwaves, radio waves, ultraviolet, and X-rays all are forms of light that we can not see. The colors of a rainbow form a continuous spectrum of light in the visible wavelength region as does the “light” in the other regions. Infrared light occurs at wavelengths just below red light, hence the name, infra- (below) red. Near-infrared is the “color” of the heating coil on an electric stove just before it glows red. The thermal (or mid-) infrared colors are found at even longer wavelengths.
Glowing vs. Reflecting
The light that we see with our eyes originates from a glowing source, a light bulb or the sun, for example. But that light also can reflect off of surfaces and reach our eyes. This allows us to see things that don’t emit their own light. Infrared light also is emitted and reflected. Unlike visible light though, infrared light is emitted by any object that has a temperature above absolute zero. With hotter temperatures comes brighter infrared light until the object emits visible light.
Temperature and Color
We can determine the temperature of a glowing object from the color of the emitted light. This is true of the sun, a light bulb, or a rock heated by the sun. The color that we see results from the wavelength region where the maximum emitted energy occurs. In the first two cases, this radiance maximum occurs in the visible wavelengths that we call yellow. In the case of the rock, its peak radiance is in the thermal IR wavelengths. Determining temperature in this manner is a useful feature of infrared measurements. As described in the next section, much more information is available if we can see a full spectrum of infrared colors.
- Why measure thermal IR energy?
A Super-Technicolor World
The colors that we see in the world around us provide more information than would be available in a black-and-white world. An orange is easy to distinguish from a grapefruit because of color. Red and yellow leaves on trees signal the transition from summer to fall. It is because of the interaction of light and matter that we see objects in different colors. If we could see the world in infrared colors, we would discover even more details.
The Interaction of Light and Matter
When matter is exposed to the electrical and magnetic components of light, the atoms and molecules within it are affected. The chlorophyll molecules in plants absorb UV and most visible wavelengths, but reflect green and near-IR light. The minerals in rocks absorb and reflect thermal IR light of different wavelengths (colors) depending on the composition of each mineral. Because every mineral absorbs and reflects thermal IR differently, each has its own spectral signature in these wavelengths. If our eyes could see thermal IR light, every mineral would have a unique color. This is also true of the gas molecules in the atmosphere and frozen molecules in ice. The TES instrument views Mars with thermal IR detecting “eyes”. This means that we can identify what minerals are on its surface, what gases are in its atmosphere, and what ices are at the poles. To learn how we measure thermal IR energy, read on.
- How is thermal IR energy measured?
Seeing the Heat
The rods and cones at the back of our eyes are designed to see visible light. When we hold up our hand to a flame, we are sensing the infrared light. But how can we “see” this light? It is possible to design detectors that sense infrared energy and convert it to electrical energy. These are similar to solar photovoltaic cells that convert visible light to electricity. Once infrared light is converted to electricity, we can easily measure the variations in electrical voltage that represent the different wavelengths. In this way, we can measure the colors that our eyes can’t see.
Making a Thermal IR Rainbow
Our eyes are not able to see the full spectrum of colors in sunlight. So much of the sun’s energy peaks in the yellow wavelengths that we need a prism or a rainbow to see the rest of the colors. Similarly, in order to see the full spectrum of thermal IR colors, we have to change how we view them. One of the ways to do this is with filters. Just like a red filter held up to the sun only passes red light, filters that pass different thermal IR colors can be created. Another way is to use a device called an interferometer. Somewhat like a prism, an interferometer can create a full spectrum of infrared light all at once. The TES instrument uses an interferometer to create a spectrum and an infrared detector to measure it. This combination is called an infrared spectrometer.
- Who Built TES?
In response to a NASA request for instrument proposals, Dr. Phil Christensendeveloped the idea of TES. His experience as a graduate student at UCLA exposed him to Mars exploration. It was there that he worked with data from the Infrared Thermal Mapper. The IRTM was a more primitive version of TES that flew on the two Viking orbiters in 1976. In 1983, when NASA called for instruments to fly on board the planned Mars Observer spacecraft, Phil answered with the TES concept. He assembled many of the same IRTM engineers from the Hughes Santa Barbara Research Center (SBRC), to help design and build TES. A team of scientists also was recruited by Phil to help guide the process. One of these scientists, Dr. Hugh Kieffer, was the principal investigator for the IRTM instrument.
- What is emissivity?
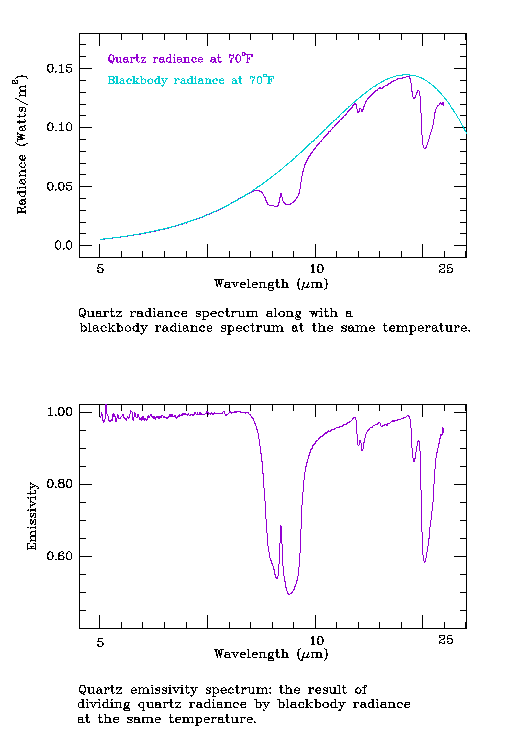
A Blackbody: the Perfect Emitter
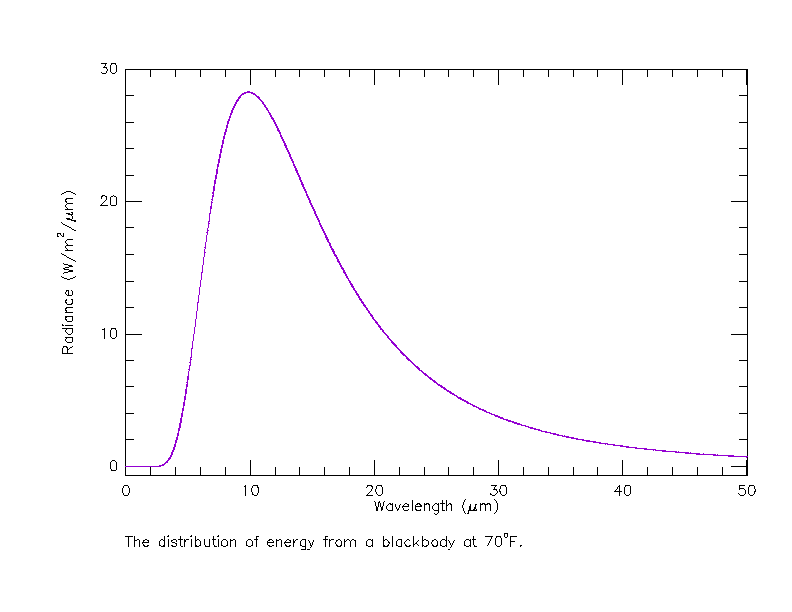
Imagine looking into a small opening of a deep cave. In the visible wavelengths, the opening looks black because the light that enters the cave is not easily reflected back out. However, the cave glows with emitted thermal IR energy. This energy emerges as a complete spectrum of all wavelengths of IR light. The radiance at each infrared wavelength is the maximum amount possible for a given temperature. If we used an infrared spectrometer to measure this emitted energy and plotted the result, it would follow a Planck distribution.Anything that emits energy with a Planck distribution can be called a blackbody. A blackbody emitter is useful for comparison with materials that do not emit perfectly at all wavelengths, which is the case for most of the matter in the universe.
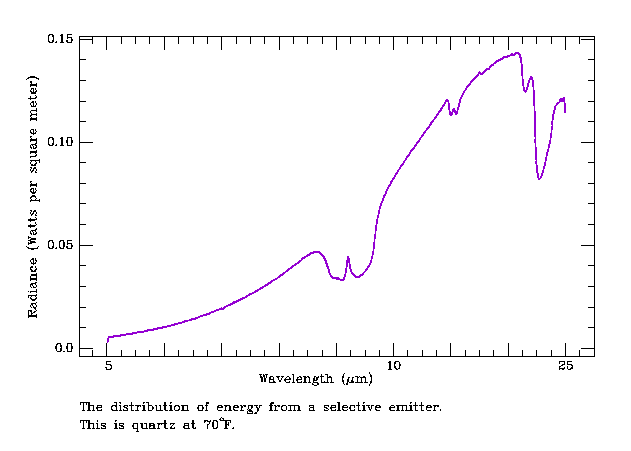
A Universe of Selective Emitters
The molecules that form the stuff of the universe (gases, liquids, and solids) result from atoms bonding together. They behave like microscopic balls on the ends of molecular springs, vibrating when agitated. This agitation arises when light of just the right wavelength hits a particular molecule. Once it starts vibrating, the molecule re-radiates the same wavelength of light. This is the process of absorption and emission. The wavelengths of light that cause molecular vibrations occur in the infrared region. Every unique molecule has its own characteristic frequency of vibration. So, unlike a blackbody emitter, molecules emit energy that departs from a Planck distribution. This means that the infrared light emitted by vibrating molecules can be used to identify them.
Emissivity: the Temperature Equalizer
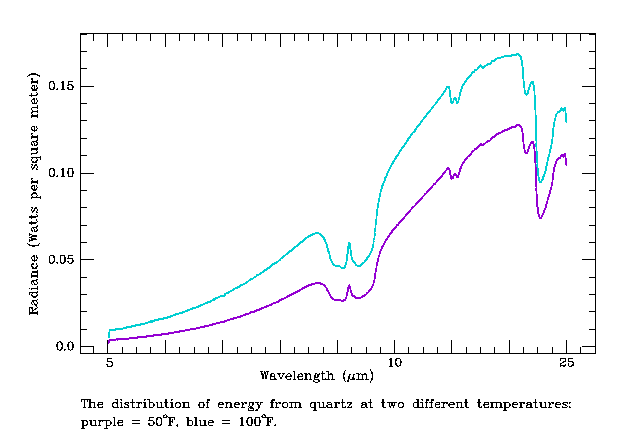
One of the ways to describe the infrared energy emitted by molecules is in terms of radiance: watts of energy per unit of area. With changes in temperature, come changes in radiance. For example, the radiance from a mineral at one temperature will be different from that at another temperature. In order to make comparisons of emission from materials at different temperatures, we need to remove the temperature effect. This is done mathematically by dividing the radiance spectrum of a selective emitter by that of a blackbody (perfect emitter) at the same temperature. The result is called an emissivity spectrum. Because it results from dividing one radiance spectrum by another, the units of watts/area cancel. Emissivity then, is a fractional representation of the amount of energy from some material vs. the energy that would come from a blackbody at the same temperature. The places in an emissivity spectrum that have a value less than one are the wavelength regions that molecules are absorbing energy. In the case of quartz (SiO2), the silicon-oxygen molecules are responsible for the absorptions.
- What is the emissivity from mixtures of materials?
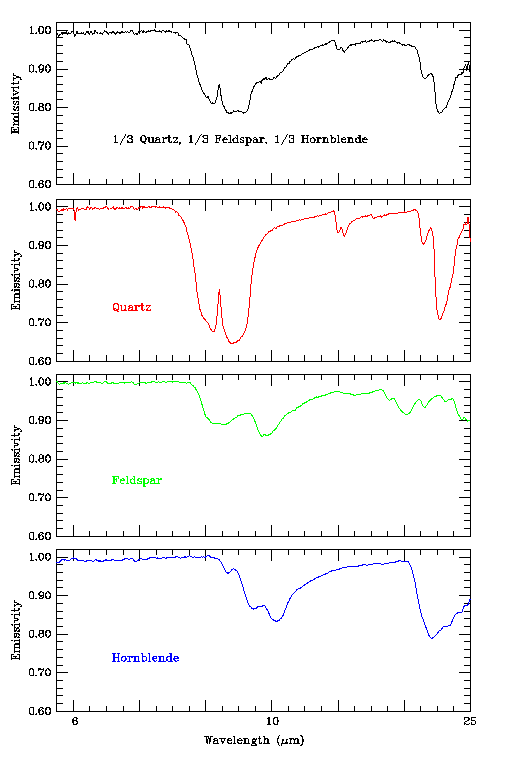
A Mixed-Up Universe
Using the emissivity spectrum from a pure material, it is easy to identify its composition. The emissivity of quartz for example, is different from that of every other substance in the universe. But materials in the universe rarely are found in their pure state. What happens to emissivity when it is measured from a mixture of materials? Fortunately, the emissivity spectrum from the individual components of a mixture add together in a simple linear fashion. A rock for example, is a mixture of different minerals. If it is composed of quartz, feldspar, and hornblende, its emissivity spectrum will appear as a mixture of all of the absorption features of each mineral. A mixed spectrum at first may appear to be hopelessly convoluted, but the fact that the component spectra add together linearly allows it to be deconvolved.
Unmixing: Making Sense of It All
Any attempt to deconvolve (unmix) a mixed emissivity spectrum requires a library of pure spectra. The features of a mixed spectrum can be compared systematically to those of the endmember spectra from the library. Individual components of the mixture are identified by matching the features of its spectrum to those in the library. In addition to identifying what is there, we can also tell how much. The depth of the absorption features in the mixed spectrum is directly related to the abundance of the endmember components. For rocks, the ability to identify the minerals and how much of each is present, tells us what kind of rock it is.
- How is emissivity used to map Mars?
The View from Above
The measurement of emissivity can be done remotely. No part of the measurement requires contact with the material being measured. Thermal infrared energy travelling at the speed of light reaches the measuring instrument no matter how far away it is. This means that an instrument placed in orbit around Mars can view the entire surface over time. With the benefit of a telescope, an orbiting spectrometer can see relatively small areas of the planet and determine the emissivity from the materials within the field of view. Because Mars has an atmosphere, this view includes molecules of gas as well as molecules of rock, dust, and ice on the surface. As described in the last section, each of these molecules contributes to the emissivity spectrum. The mixed spectra from the orbiting instrument have to be deconvolved (unmixed) using a spectral library, in order to identify the different materials in the scene.
A Firehose Stream of Data
An orbiting spectrometer needs to be able to send the emissivity spectra it has collected back to Earth. Thermal IR energy that leaves the surface of Mars is converted to electrical impulses by the detector. An onboard computer changes these to digital values that can be broadcast as radio waves. The radio waves are picked up by dish antennas on Earth and ultimately converted back to digital data to be read on computers. In the case of the Thermal Emission Spectrometer, this process occurred 100,000 times per day for the Mars Global Surveyor mission. Even with the help of computers, the wealth of spectral data returning from Mars will keep many scientists busy for years (decades?) to come.
Meet the Group
Principal Investigator
- Dr. Philip Christensen
- Arizona State University
Co-Investigators
- Stillman Chase
- Santa Barbara, CA
- Dr. Roger Clark
- U. S. Geological Survey, Denver, CO
- Dr. Hugh Kieffer
- Celestial Reasonings, NV
- Dr. Ruslan Kuzmin
- Vernadsky Institute
- Dr. Michael Malin
- Malin Space Science Systems
- Dr. John Pearl
- Goddard Space Flight Center
Participating Scientists
- Dr. Joshua Bandfield
- Arizona State University
- Dr. Todd Clancy
- Space Science Institute
- Dr. Barney Conrath
- Goddard Space Flight Center
- Dr. Michael Smith
- Goddard Space Flight Center
- Dr. Michael Wolff
- Space Science Institute
Instrument and Mission Operations Manager
- Greg Mehall
- Arizona State University